The energy landscape theory of protein folding is a statistical description of a protein's potential surface. It suggests that the most realistic model of a protein is a minimally frustrated heteropolymer with a rugged funnel-like landscape biased toward the native state [1]. This statistical description has been developed using tools from the statistical mechanics of disordered systems, polymers, and phase transitions of finite systems.
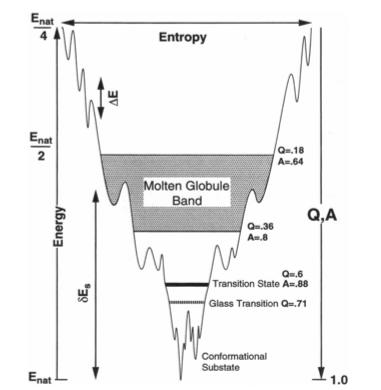
Natural proteins as we observe them today are highly evolved complex systems. Self-assembly and mutual recognition of these polypeptides into defined structural ensembles is a fundamental aspect of the biology of macromolecules, the specificity of which is physically captured by the "Principle of minimal frustration" [2]. This principle states that the energy of the protein decreases more than what may be expected by chance as the protein assumes conformations progressively more like the ground (native) state. In other words, there is a strong energetic bias towards the native basin that overcomes both the asperities of the landscape and ultimately the entropy of the chain. When energetic frustration is low enough, the native energy and folding entropy primarily compete. Since these mainly depend on protein topology, topology becomes a key factor governing folding reactions. It has been shown that the structures of transition state ensembles [3,4], the folding rate [5], the existence of folding intermediates [6], dimerization mechanisms [7], and domain swapping events [8] are often well predicted in models where energetic frustration has been removed and topological information of the native state is the sole input. Still, inhomogeneity in the native contacts energetics, non-native interactions and the residual local frustration present in the native ensemble do contribute to the functional characteristics of proteins, 'molding' the roughness that underlies the detailed protein dynamics [9,10].
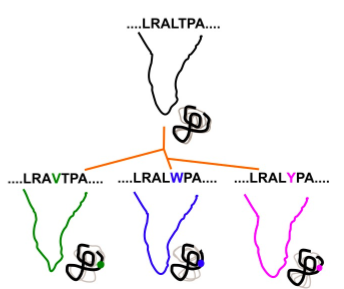
Proteins evolve through sequence changes that affect their folding and function. These sequence changes are constrained by the energy landscape and by function. That is, proteins are not only optimized to fold, but also to perform a biological function. Because changes in sequence occur faster than changes in structure, within a protein family the structures are more similar than the sequences. The study of the frustration patterns in protein families provides us with information about energy landscape and function constrains. Since those positions, in a MSA (multiple sequence aligment), that show a conservation of the minimally frustrated frustration state are associated with maintaining the structure of the protein. On the other hand, positions conserved in the highly frustrated state, which are in conflict with the structure, are associated with the dynamics and function of the protein. Thus, by studying frustration patterns we can detect, within a protein family, those positions that are constrained.
How the algorithm works
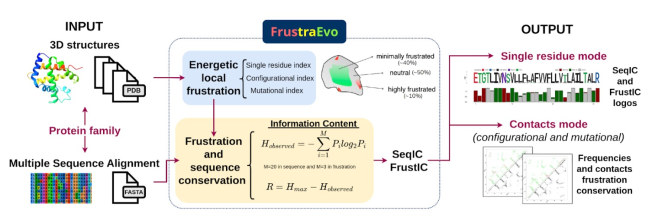
Given a MSA and the corresponding set of structures, we map energetic local frustration values from the structures into each aligned residue within the MSA. Information Content theory is used to calculate sequence and energetic local frustration conservation for each aligned set of residues within the MSA. We demonstrate the usefulness of studying these conservation patterns to 1) retrieve stability constraints as well as functional ones within protein families, 2) study the divergence of related protein families, 3) modify the biophysical behavior of a given protein based on its evolutionary frustration patterns, and 4) finally to show the general applicability of our method we develop an unsupervised strategy to rapidly elicit sequence and energetic constraints in large datasets. FrustraEvo and the concept of evolutionary frustration will be of great value to the study of protein families and superfamilies, to the development of information-driven strategies for protein design and to the large scale study of sequence-structure-function relationships in proteins.
Frustration measures how energetically favorable a particular contact is with respect to set of all possible contacts at that location, normalized using the variance of that distribution.
Contacts are defined according to the value of the calculated frustration index. If the value of frustration index is 0.78 or higher magnitude [11], the contact is defined as 'minimally frustrated', this means, that other amino acid pairs in that position would be energetically unfavorable. If the local frustration index is lower than -1, the contact is defined as 'highly frustrated', that is, that other amino acid pairs in that position would be energetically more favorable for folding than the native ones. If the native energy is in between these limits, the contact is defined as 'neutral'.
Frustratometer can calculate frustration in 3 modes, the difference is in how the decoy set is generated, 2 for contacts, i.e. mutational and configurational frustraion indexes (FIs), and a single residue frustration index (SRFI) [17].
To explain results, we start by using the SRFI results. Let’s take the case of IM7 (link to the job example).
FrustraEvo first calculates frustration patterns to all the structures in the submitted dataset and maps frustration values from each of the structures to the corresponding sequence in the MSA, generating a MSFA (Multiple Sequence Frustration Alignment)

The next step in the algorithm involves to use Information Theory concepts to measure the conservation degree of frustration states on each of the MSFA columns.
Frustration conservation
The calculation of evolutionary frustration based on the single residue FI which can analogously be applied to contacts as well. Given a Multiple Sequence Alignment (MSA) and the corresponding structures for each sequence contained in the MSA, we can map local frustration values from the structures to each aligned residue within the MSA. Evolutionary frustration refers to the quantification of this conservation by calculating the Information Content (IC) for each MSA column, using the Shannon information content formulas:
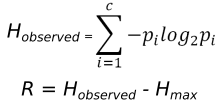
The background frequencies for the minimally, neutral and highly frustrated states are defined as ~40%, ~50% and ~10% respectively, in correspondence to the frequencies observed by Ferreiro et al. [11] for the single residue, configurational and mutational indexes. The more conserved the frustration state is in a given MSA position, the higher its FrustIC will be and vice versa.
Frustration Logo
The MSA is processed such that only columns that have an amino acid (no gap positions) in the reference structure are kept. The Frustration Information Content (FrustIC) based on the distribution of frustration states and using Shannon information content formulas for each column in the MSA is calculated. As a result, for each position of the ungapped MSA, the information content contributions from each frustration state will calculate. The total information content of a given position will be calculated as the sum of the individual contributions from each frustration state.
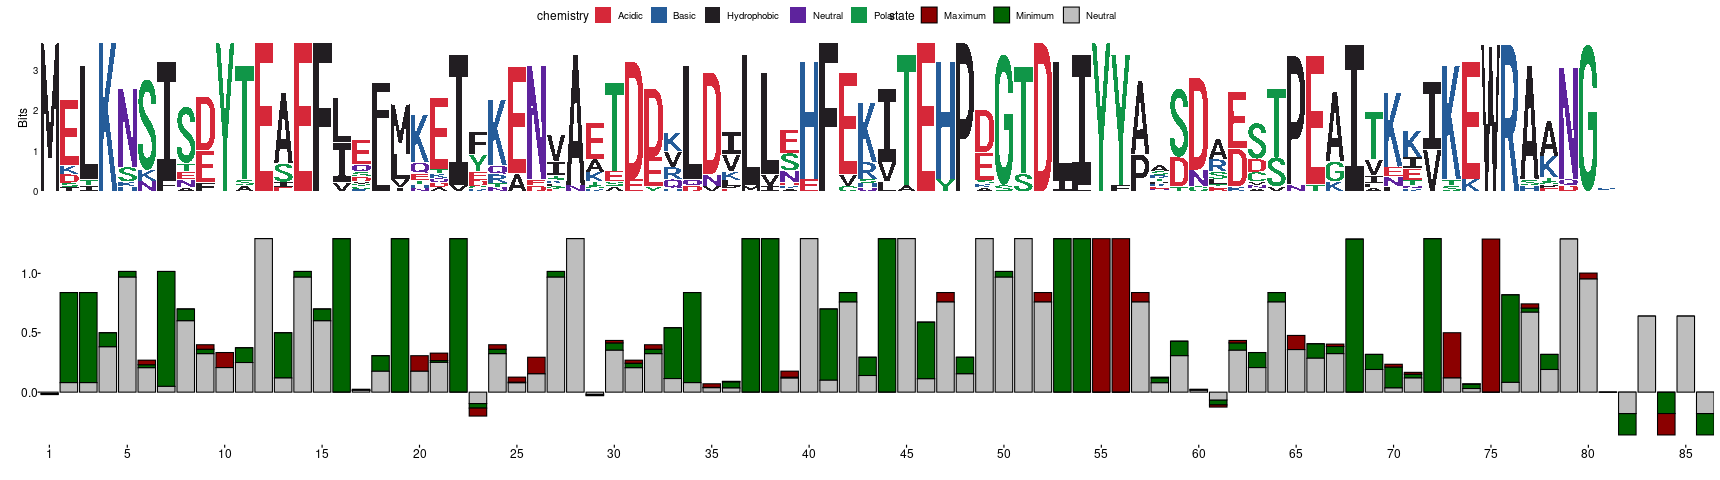
In the previous figure, you can observe a typical sequence logo below which you can find a frustration logo that is derived in the same way. The way to interpret the frustration logo is analogous to the sequence one. Positions in the MSFA with high conservation of their frustration states will display tall bars (maximum theoretical height is log2(3)=1.58) while those with no conservation will be closer to 0 (or even negative values if the distribution of states do not follow what is expected according to the background frequencies used by the algorithm). Each bar will be constituted by 3 stacked proportions that correspond to the amount of information consent that each state contributes to the total height of the bar. We consider a position to be energetically conserved if its associated Frustration Information Content (FrustIC) is higher than 0.5. In the Im7 example we can easily see that Y55 and Y56 are in energetic conflict in a majority of the family members (tall, red bars) and therefore might be functionally relevant (these residues are known to be important to bind Colicin E7). Some other positions seem to be important for local stability, e.g. positions 19, 22, 37, 38, 53 or 54 that correspond to hydrophobic residues that are part of the hydrophobic core of the protein. On the contrary, some positions are not energetically conserved (small bars). This can be accompanied by sequence variability or not. Interpretation of such positions goes as follows. These bars are small because the frustration states distribution in that MSFA column is heterogeneous. This heterogeneity can be accompanied by sequence variability which can be its cause, as well as sequence variability in the contacting residues, the occurrence of nearby insertions or deletions. It can also be possible that positions with high sequence conservation have no frustration conservation. In this case, it might be useful to explore structural conformational variability of the region. This is because disordered or highly flexible regions can have multiple conservations in the static structure with heterogeneous frustration values even when having exactly the same sequence.
Frustration ContactMaps
Similarly to the Frustration Logo, a reference structure is taken to define the contacts to be evaluated.
Taking in consideration that the MSA was ungapped according to the reference structure, the frequency of having
a contact between columns i, j in the MSA, on each structure in the dataset is calculated.
Where i, j ∈ [1, N], with N being the number of columns in the ungapped MSA. Subsequently, a
Frustration information content is calculated for each possible i,j contact, using the distribution of
observed frustration states across the structures that contain the i,j contact.
As a result for each possible contact, according to pairs of columns within the ungapped MSA,
the information content contributions from each frustration state is calculated. The total information content
of a given contact will be calculated as the sum of the individual contributions from each frustration state.
In what follows we show the contact map that results from using the mutational frustration index.
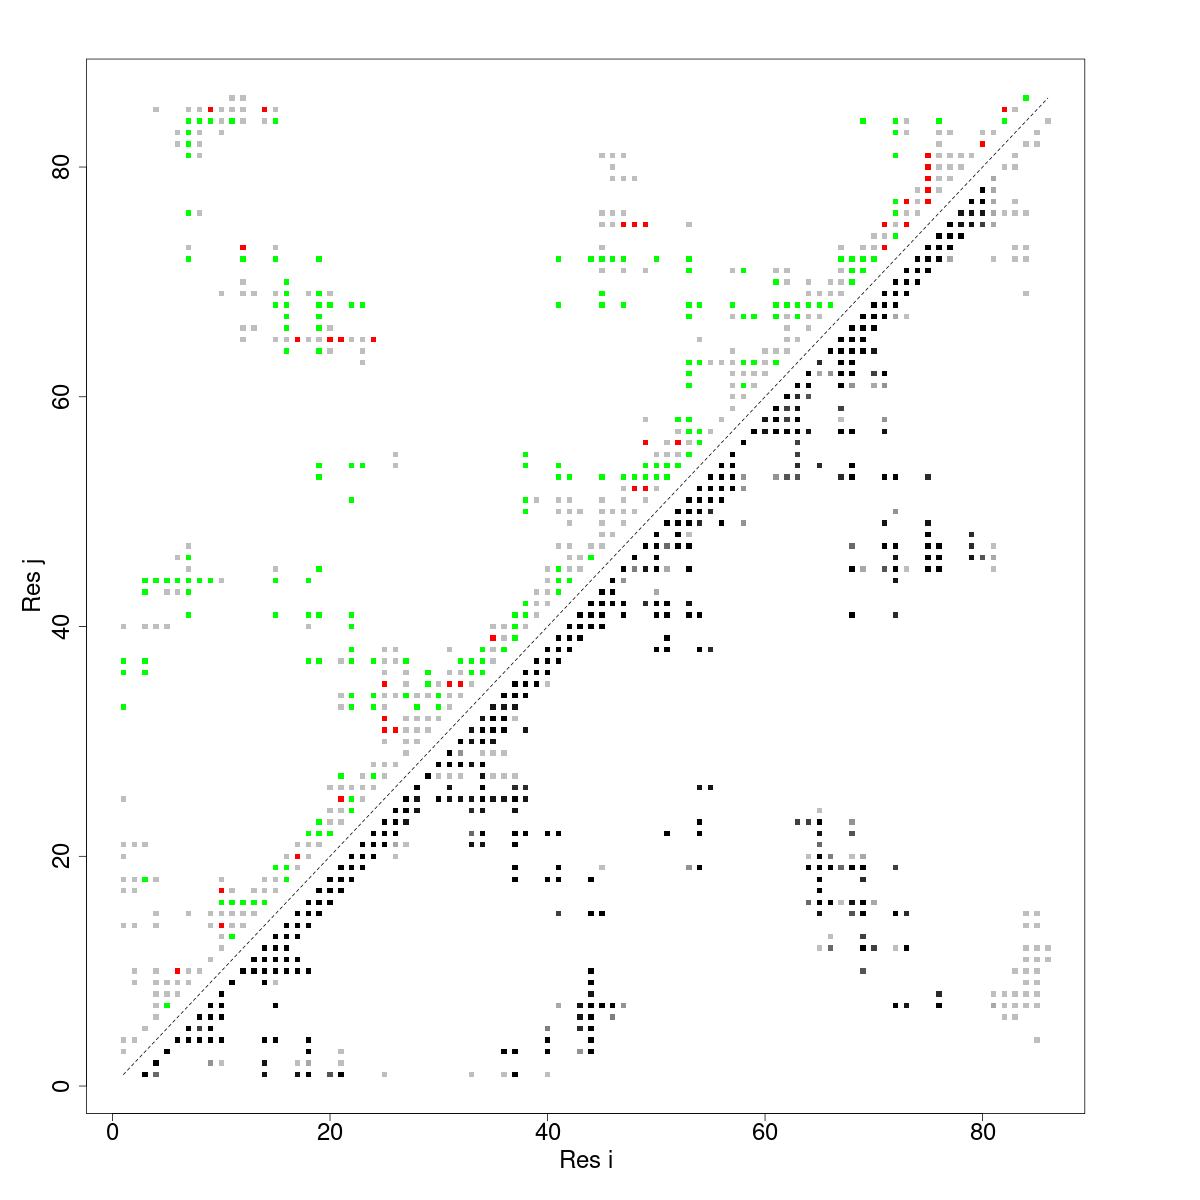
In the case of contact maps we pay attention to 3 things for each contact. 1) The Frustration Information Content (FrustIC, not shown in the figure), 2) the frustration state that contributes more energy to the total FrustIC (upper diagonal matrix) and 3) the proportion of structures relative to the total in the submitted dataset. In our analysis we often pay attention to contacts with FrustIC values higher than 0.5 and that are present in more than 50% of structures.
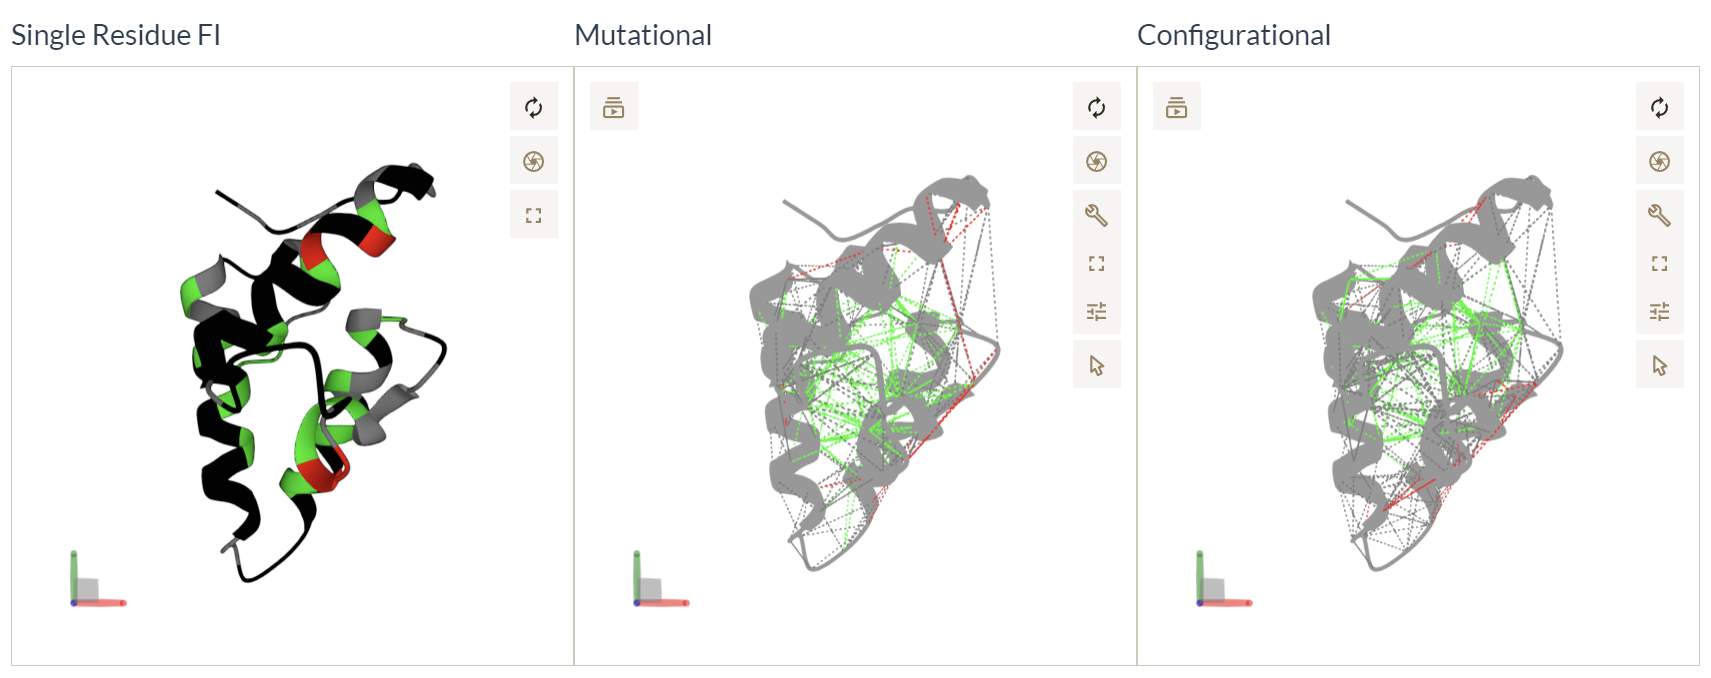
Mapping SRFI and Pairwise configurational and mutational frustration indexes into structures
We map residues with FrustIC>0.5 to the structure and color them according to the most informative frustration state in the corresponding MSFA column. Residues with FrustIC<=0.5 (i.e. not energetically conserved) are coloured in black. Similarly, we map contacts from both the mutational and the configurational frustration indexes into the structure. We map contacts with FrustIC>0.5 and that are present in at least 50% of the structures in the submitted dataset. These 3 representations offer complementary ways to analyse the evolutionary constraints that are present in the dataset.
-
Input files structure and format.
The input files are two, a zip file containing all the structures to be analyzed and a file in fasta format. Each sequence in the alignment has to correspond to a structure and the header of each sequence has to be the same name as the corresponding PDBID.

-
Why are there less proteins in the output compared to the input?
Be aware that the sequences in the MSA need to match exactly those contained in the PDB structures. Proteins where MSA and PDB extracted sequences do not match are filtered out from the input files. -
What does the height and color of the evolutionary frustration logo bars mean?
The height of the bars in the frustration logo indicates the value of the information content (FrustIC) and the colors represent the state of frustration that is most conserved.
The color scheme is:
Minimally frustrated.
Highly frustrated.
Neutral.
(visit our study cases page). -
What does the contact map represent?
Each dot represents pair-interactions between aminoacids, numbered on the axis. They are colored according to their frustration index. The other ones are projections of the contact information on the sequence space. -
What is the minimum and maximum number of structures?
The minimum number of structures/sequences we recommend using is 15 and there is no maximum number to use. Just keep in mind that the time taken to generate the outputs depends on the sequence length and the number of input structures/sequences. -
Can I download the results?
Yes you can. Fetch the results page of your job by entering your job ID in the field below, or by following the link contained in the email we sent you. Then click in the Download link in the bottom of the results page.
- Theory of protein folding: the energy landscape perspective
Onuchic JN, Luthey-Schulten Z, Wolynes PG
Annu Rev Phys Chem - 1997 - [pdf] - Spin glasses and the statistical mechanics of protein folding
Bryngelson JD, Wolynes PG
Proc Natl Acad Sci USA - 1987 - [pdf] - Topological and energetic factors: what determines the structural details of the transition state ensemble and "en-route" intermediates for protein folding? An investigation for small globular proteins
Clementi C, Nymeyer H, Onuchic JN
J Mol Biol - 2000 - [pdf] - Roles of native topology and chain-length scaling in protein folding: a simulation study with a Go-like model
Koga N, Takada S
J Mol Biol - 2001 - [pdf] - Quantifying the roughness on the free energy landscape: entropic bottlenecks and protein folding rates
Chavez LL, Onuchic JN, Clementi C
J Am Chem Soc - 2004 - [pdf] - The energy landscape of modular repeat proteins: topology determines folding mechanism in the ankyrin family
Ferreiro DU, Cho SS, Komives EA, Wolynes PG
J Mol Biol - 2005 - [pdf] - Protein topology determines binding mechanism
Levy Y, Wolynes PG, Onuchic JN
Proc Natl Acad Sci USA - 2004 - [pdf] - Domain swapping is a consequence of minimal frustration
Yang S, Cho SS, Levy Y, Cheung MS, Levine H, Wolynes PG, Onuchic JN
Proc Natl Acad Sci USA - 2004 - [pdf] - The Energy Lanscapes and Motions of Poteins
Frauenfelder H, Sligar SG, Wolynes PG
Science - 1991 - [pdf] - The spectrum of biomolecular states and motions
Hegler JA, Weinkam P , Wolynes PG
HFSP Journal - 2008 - [pdf] - Localizing frustration in native proteins and protein assemblies
Ferreiro DU, Hegler JA, Komives EA, Wolynes PG
Proc Natl Acad Sci USA - 2007 - [pdf] - Supplementary Methods to reference 11 [pdf]
- Water in protein structure prediction
Papoian GA, Ulander J, Eastwood MP, Luthey-Schulten Z, Wolynes PG
Proc Natl Acad Sci USA - 2003 - [pdf] - Consequences of localized frustration for the folding mechanism of the IM7 protein
Sutto L, Latzer J, Hegler JA, Ferreiro DU, Wolynes PG
Proc Natl Acad Sci USA - 2007 - [pdf] - The capillarity picture and the kinetics of one-dimensional protein folding
Ferreiro DU, Wolynes PG
Proc Natl Acad Sci USA - 2008 - [pdf] - On the role of frustration in the energy landscapes of allosteric proteins
Ferreiro DU, Hegler JA, Komives EA, Wolynes PG
Proc Natl Acad Sci USA - 2011 - [pdf] - Protein frustratometer: a tool to localize energetic frustration in protein molecules.
Michael Jenik; R. Gonzalo Parra; Leandro G. Radusky; Adrian Turjanski; Peter G. Wolynes; Diego U. Ferreiro.
Nucleic Acids Research 2012; doi: 10.1093/nar/gks447 - [pdf] - FrustratometeR: an R-package to compute local frustration in protein structures, point mutants and MD simulations
Atilio O Rausch, Maria I Freiberger, Cesar O Leonetti, Diego M Luna, Leandro G Radusky, Peter G Wolynes, Diego U Ferreiro, R Gonzalo Parra.
Bioinformatics 2021; doi: 10.1093/bioinformatics/btab176 - [pdf] - Local frustration around enzyme active sites
Maria I. Freiberger, A. Brenda Guzovsky, Peter G. Wolynes, R. Gonzalo Parra, Diego U. Ferreiro
PNAS 2019; doi: 10.1073/pnas.1819859116[pdf] - The structure of Toho1 b-lactamase in complex with penicillin reveals the role of Tyr105 in substrate recognition
Patricia S. Langan, Venu Gopal Vandavasi, Kevin L. Weiss, Jonathan B. Cooper, Stephan L. Ginell and Leighton Coates
FEBS PRESS 2016; doi: 10.1002/2211-5463.12132 [pdf] - Effects of Asp-179 mutations in TEMpUC19 beta-lactamase on susceptibility to beta-lactams
S B Vakulenko, M Tóth, P Taibi, S Mobashery, S A Lerner
Antimicrob Agents Chemother 1995; doi: 10.1128/AAC.39.8.1878 [pdf] - SOD1 exhibits allosteric frustration to facilitate metal binding affinity
A Das, SS Plotkin
PNAS 2013; doi: 10.1073/pnas.1216597110 [pdf] - The Evolution of Local Energetic Frustration in Protein Families
Maria I. Freiberger, Victoria I. Ruiz-Serra, Camila Pontes, Miguel Romero-Durana, Pablo Galaz-Davison, Cesar Ramírez-Sarmiento, Claudio D. Schuster, Marcelo A. Marti, Peter G. Wolynes, Diego U. Ferreiro, R. Gonzalo Parra and Alfonso Valencia
bioRxiv 2023; doi: 10.1101/2023.01.25.525527 [pdf]
How to cite this application
Coming soon.
This server and its associated data and services are free and open to all users. It is a non-profit service to the scientific community. The responsibility of Universidad de Buenos Aires and the Barcelona Supercomputing Center is limited to applying best efforts in providing and publishing good programs and data. Universidad de Buenos Aires and the Barcelona Supercomputing Center have no responsibility for the use of results, data or information which have been provided through this server.
How to cite this application
Please cite:
RG Parra, et al.
PLoS computational biology. (2015)
Pubmed
MI Freiberger, et al.
PNAS. (2019)
Pubmed
MI Freiberger, et al.
Nature Comms (2023)
Pubmed